
The average Camden home is £815,159, down £91,914 on July last year. It is the steepest annual fall in eleven years, and flats took the worst of it.
The average Camden home was worth £815,159 in July, down £91,914 on the same month last year. That is a fall of 10.1 per cent, and it is the steepest twelve-month drop the borough has recorded in the UK House Price Index in at least eleven years.
HM Land Registry published the July figures on 16 September. England as a whole rose 1.1 per cent over the same year, to £293,479.
We checked every month of the index for Camden back to January 2015, all 139 of them. The worst annual fall before this one was 8.5 per cent, in July 2020.
The comparison is with the highest month on record
One number explains most of the headline. July 2025, the month this is measured against, was £907,073. Across those same 139 months, that is the highest average the index has ever given Camden.
So the borough is being compared with its own peak, which makes a large negative number almost arithmetically certain. That does not make the fall fake. It does mean the 10.1 per cent is as much about where last summer ended up as about where this summer is.
Camden has now fallen for two months running:
- May 2026: £843,425
- June 2026: £834,198, down £9,227
- July 2026: £815,159, down a further £19,039
That is £28,266 off the average in two months. July is still above February’s £795,336, which remains the lowest point of the current cycle.
Flats fell furthest, and flats are what Camden sells
The borough average hides a wide spread by property type. Annual change to July 2026:
| Property type | July 2026 average | Change on July 2025 |
|---|---|---|
| Detached | £3,645,110 | −£144,893 (−3.8%) |
| Semi-detached | £2,117,585 | −£138,660 (−6.1%) |
| Terraced | £1,554,868 | −£125,579 (−7.5%) |
| Flat or maisonette | £671,443 | −£81,070 (−10.8%) |
| First-time buyer | £711,980 | −£82,031 (−10.3%) |
The order matters here more than in most boroughs. Our own analysis of Land Registry sales found that flats were 1,071 of the 1,301 completed Camden sales in the year to June, about 82 per cent of the market, which is set out on our Camden house prices page. The type that fell hardest is the type most people here actually buy and sell.
A first-time buyer in Camden is still looking at an average of £711,980. That is more than double the England average for all buyers.
This is a central London story, not a Camden one
Put the boroughs side by side and the pattern is geographic. Everywhere near the middle of London is falling, and the further out you go, the less it falls.
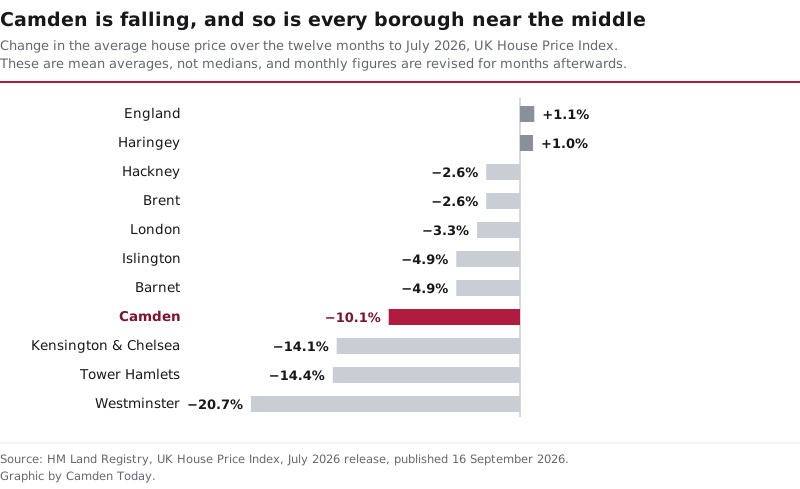
Westminster is down 20.7 per cent to £876,788. Tower Hamlets is down 14.4 per cent and Kensington and Chelsea 14.1 per cent. Camden’s fall is smaller than all three, and Westminster is a Camden neighbour, so the worst of it is right next door. But Camden also fell more than twice as far as Islington and Barnet, both down 4.9 per cent, and nearly four times as far as Brent and Hackney, down 2.6 per cent each. Haringey rose 1.0 per cent.
London overall fell 3.3 per cent, to £550,037. Every figure here is from the same July 2026 release.
Read these numbers with the two warnings attached
The index is a mean, not a median. One £9m sale in Hampstead moves it; the middle of the market does not. The typical Camden sale price, taken from completed transactions, was £740,000 in the year to June, roughly £75,000 below the July mean.
The monthly figures are revised, and in Camden they are revised a lot. When we reported the June index in August, it read £833,067 and April read £793,161. Those now read £834,198 and £805,447. April is no longer the floor of the cycle; February is.
The reason is thin volumes. Camden recorded 170 sales in July 2025 and 81 in May 2026, the most recent month with a published count. Volumes for June and July 2026 have not been published yet. When a borough average rests on fewer than a hundred sales, a handful of late registrations moves it.
What it means for you
- If you are selling, the asking price a Camden agent quoted you last summer is not the market you are in now. The index says the average is £91,914 lower than it was in July 2025.
- If you are buying a flat, this is where the fall has actually happened. The average flat is £81,070 cheaper than a year ago.
- If you are remortgaging, a falling index can push you into a worse loan-to-value band even though nothing about your home has changed. Check the band before you apply.
- Do not use the borough average for one street. Ward medians in Camden range from about £1.6m in Hampstead Town to £521,000 in Kilburn, and our house prices page breaks them down.
- Your council tax band does not move with prices. Bands are still set on 1991 values, which is explained on our council tax page.
Correction and update note, 19 September 2026: our report on the June index, published 21 August, used the figures available at the time. HM Land Registry has since revised June up from £833,067 to £834,198, May up from £830,654 to £843,425, and April up from £793,161 to £805,447. The April low we described in that piece no longer stands; the lowest month of the current cycle is now February 2026.
Sources: HM Land Registry, UK House Price Index, July 2026 release, published 16 September 2026, for Camden, London, England, Islington, Westminster, Kensington and Chelsea, Tower Hamlets, Hackney, Haringey, Brent and Barnet. Monthly series for Camden checked for every month from January 2015 to July 2026. Median and ward figures from HM Land Registry Price Paid data for the year to June 2026, as published on our Camden house prices page.
Have your say